Determining Membrane Orientation of Transmembrane Proteins
Usage
Data Input

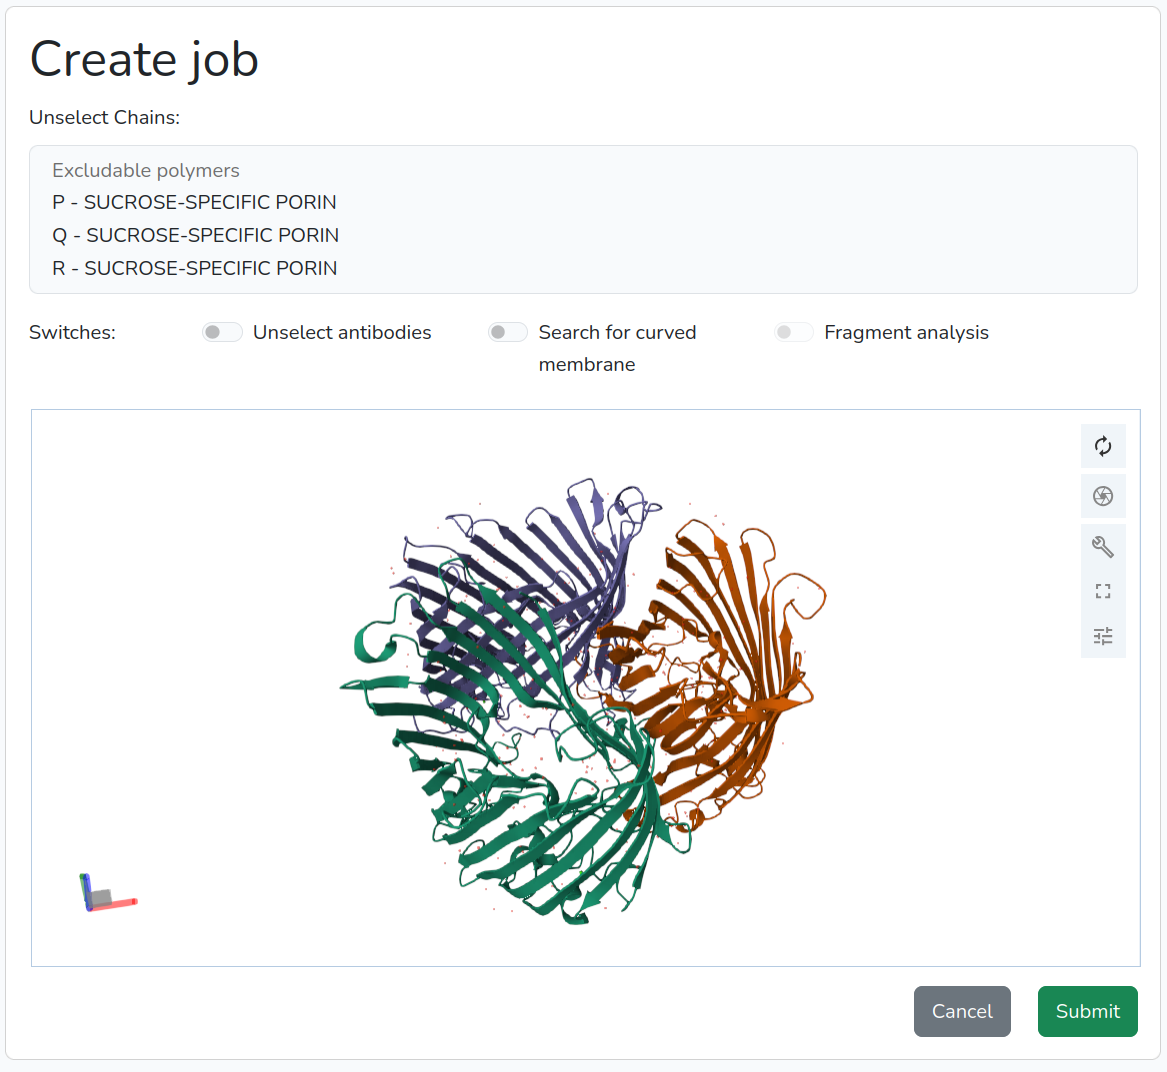
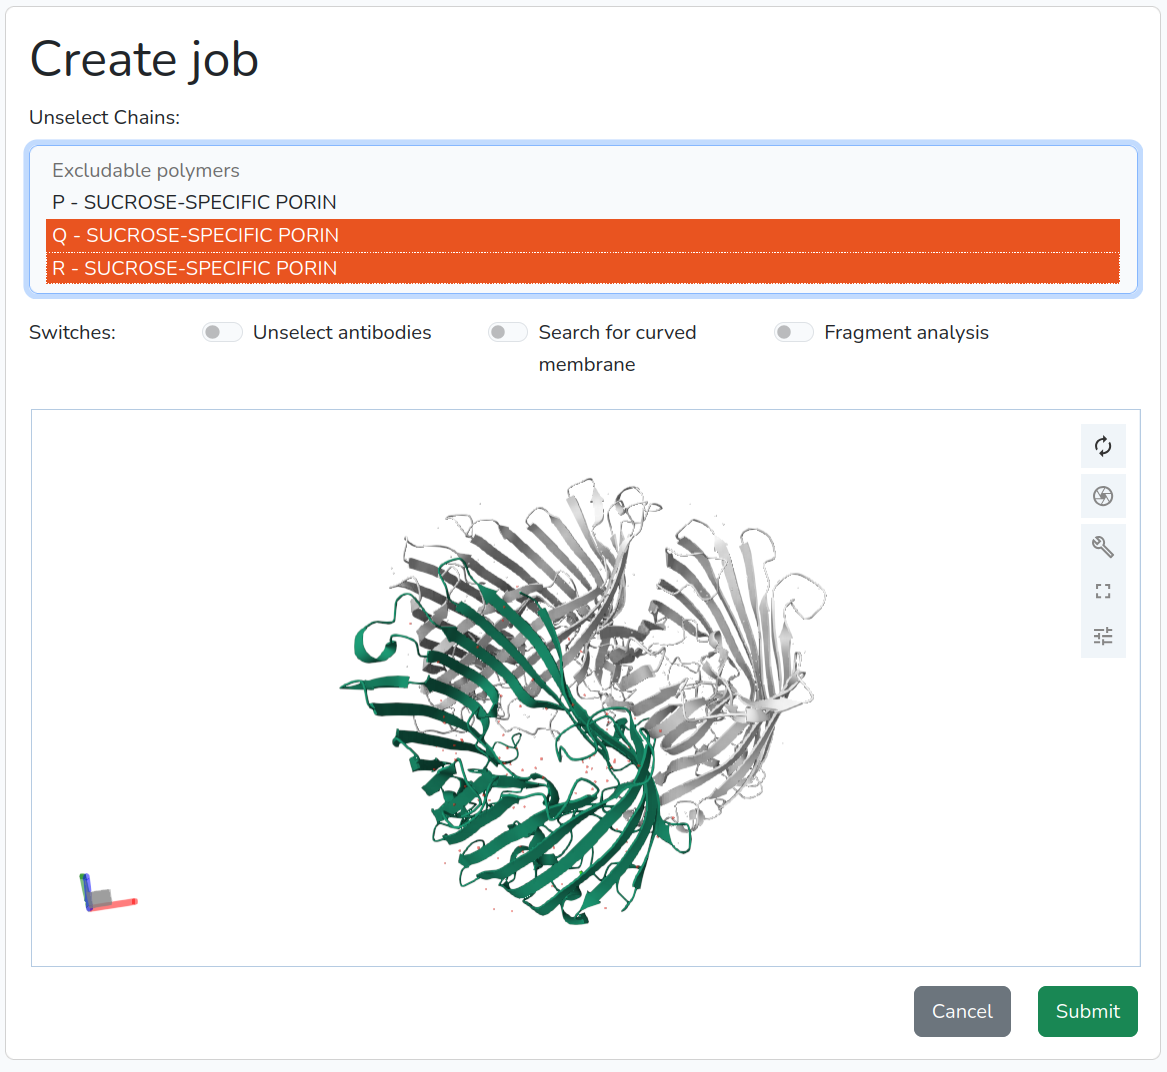
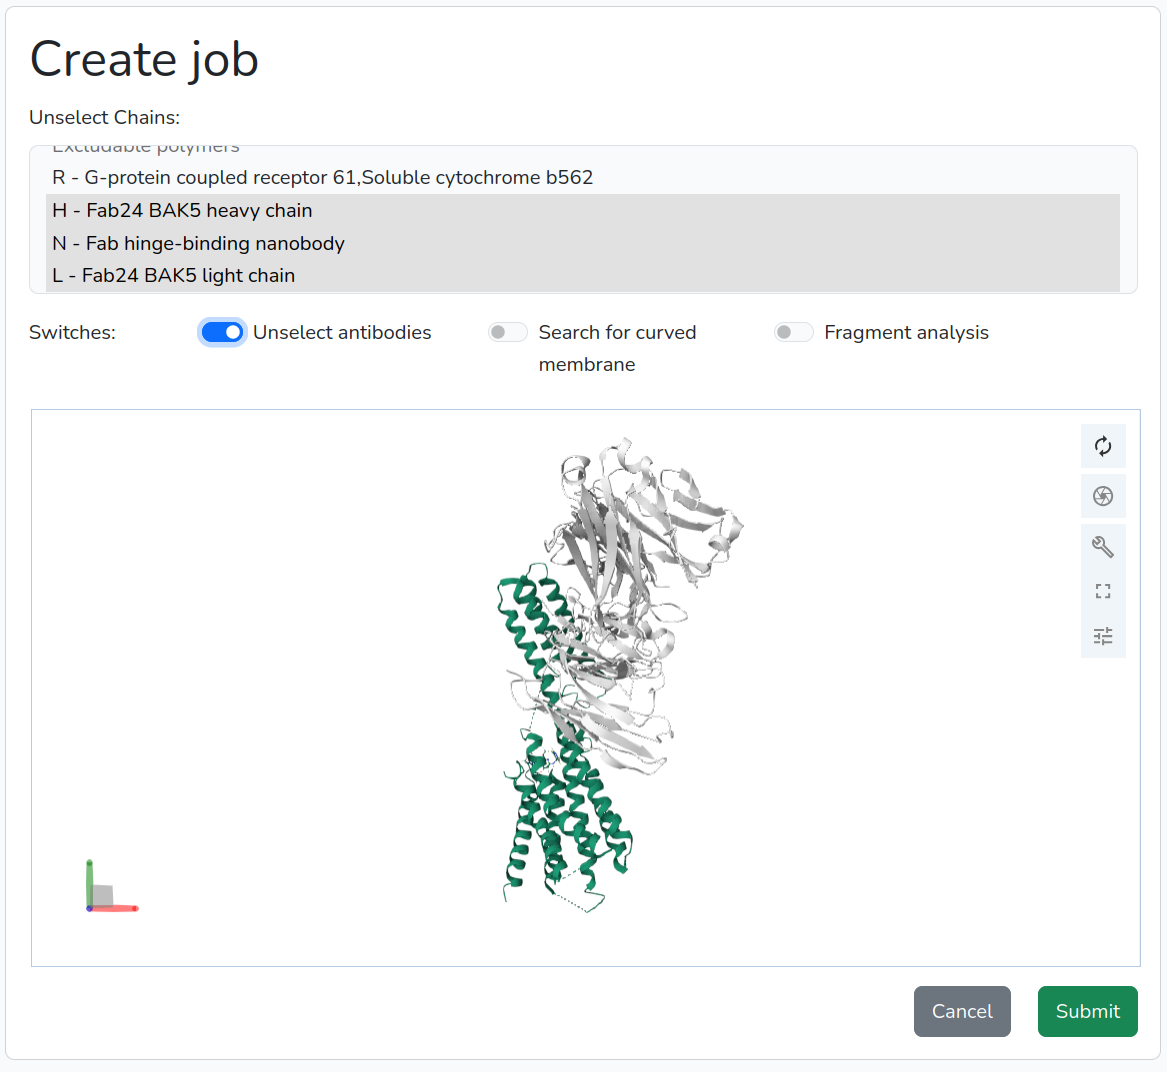
- If the user wishes to analyze only specific chains rather than the entire structure, they can remove unwanted chains by clicking on the chain name in the list. To select multiple chains, hold Shift and click; to deselect, use Ctrl+click. Removed chains will appear in gray in the structure (Figure 2).
- Some transmembrane proteins curve the membrane during their function (e.g., the mechanosensitive ion channel). The new TmDet algorithm allows for the detection of curved membrane surfaces. Users can enable this feature by clicking the "Search For Curved Membrane" button.
- If a user wants to examine a protein model that was generated without considering the structural constraints imposed by the lipid bilayer, the modeling program may fold globular parts of the protein into the membrane region, alongside the transmembrane regions. This is a common error in AlphaFold modelled transmembrane protein structures. To detect such errors, users can select the "Fragment Analysis" option.

Job List
After a successful submission, or by selecting the "My jobs" menu, user can view a list of their submitted jobs and their status (Processing or Completed). For completed jobs, user are able to invetigate the results, share the job by copying its url, recalculate with different parameters, or delete the job.Results viewer
On this page, users can analyze/handle the results in 5 panels.-
Summary tab:
This tab displays some basic information such as the protein code, protein type (Tm_Alpha, Tm_Beta, TM_Mixed, or Soluble for non-transmembrane proteins), and the resulting qValue (more information about this is available on the Description page). -
1D tab:
This tab shows the amino acid sequences of each protein chain in fasta format, colored according to the region types (color codes are provided on the bottom of the page). The viewer uses the auth_asym_id specified in the cif file (or chain identifier in the PDB file) to identify the protein chains. -
3D tab:
Clicking the view button opens the 3D tab, which displays the protein embedded in the membrane using the Mol* molecule viewer. The lipid bilayer is represented by gray spheres, and the individual regions are colored according to their position relative to the membrane (the meaning of the colors is found on the Legend tab). Hovering the mouse over an element of the structure, Mol* displays the region type and the starting and ending residue numbers (Figure 3). -
Download tab:
On this tab, you can download both an XML file containing the annotated types of the regions and a cif file containing the transformed structure and the atoms representing the membrane region, as well as view them in their raw form. Additionally, users can download these files as a zipped archive.

Definition of annotated regions
- Transmembrane
-
Description:Region that cross the membrane.Code:H for helices and B for beta barrelsColor:yellow
- Re-entrant loop
-
Description:Region that enters and exits on the same side of the membrane.Code:LColor:orange
- Interfacial helix
-
Description:Helical region that is parallel to the membrane plane and localized near the membrane surface.Code:FColor:green
- Beta barrel inside
-
Description:Regions that are inside the beta barrel and are not part of the barrel.Code:NColor:purple
- Side one
-
Description:Region that is outside the membrane (i.e. not in the membrane) on one side the membrane (see FAQ for explanation).Code:1Color:light red
- Side two
-
Description:Region that is outside the membrane (i.e. not in the membrane) on other side the membrane (see FAQ for explanation).Code:2Color:light blue
- Periplasm or intermembrane
-
Description:Region that is between the inner and outer bacterial or mithocondrial membrane. It is produced only if double membrane detection is active.Code:3Color:cyan
- False positive membrane
-
Description:If the structure can only be embedded into the membrane in such a way that a globular, water-soluble part of the protein falls between the modeled membrane planes, then these regions that do not fit into the membrane are called false positive regions. They are created only when fragment analysis is active.Code:PColor:red
- False negativ membrane
-
Description:If the structure contains two or more structural elements that all correspond to transmembrane regions according to the TmDet algorithm but are not in the same plane, then those that are out of the common plane are called false negative regions. They are created only when fragment analysis is active.Code:RColor:blue